Measuring ROI from Procurement Efficiency Software: A Complete Guide
Measuring ROI from Procurement Efficiency Software: A Complete Guide
How Companies Measure ROI from Procurement Software
Companies measure ROI from procurement software by tracking a combination of cost savings, processing time reductions, error rates, and compliance improvements against the total investment in the platform. The calculation is straightforward at its core, but the real value lies in knowing which metrics to track and when.
This guide breaks down the exact framework procurement teams use to quantify results, from baseline setup to ongoing KPI monitoring. You will find the essential PO automation metrics, a simple numeric ROI example, and a clear look at how AI-powered platforms like Hyperbots are helping organizations cut operational costs by up to 80%. Whether you are evaluating a new solution or trying to prove value to leadership, this guide gives you a practical, numbers-first approach.
Understanding ROI in Procurement Automation
Return on investment in procurement efficiency software encompasses both quantifiable financial benefits and strategic operational improvements. Unlike traditional ROI calculations that focus solely on cost savings, modern procurement ROI analysis incorporates efficiency gains, risk reduction, and enhanced decision-making capabilities.
The fundamental ROI formula for procurement automation is:
ROI = (Benefits - Investment Costs) / Investment Costs × 100
However, measuring the ROI of procurement software requires a more nuanced approach that accounts for:
Direct cost savings through process automation
Efficiency improvements in cycle times and resource allocation
Risk mitigation through enhanced compliance and controls
Strategic value creation through improved spend visibility and analytics
According to the World Economic Forum's Future of Jobs Report, more than 80% of business executives are accelerating plans to digitize work processes and deploy new technologies, yet many procurement teams still struggle to quantify the tangible benefits of their digital transformation efforts.
Setting the purchasing ROI target at 10x the internal investments is a good procurement strategy, though actual returns vary based on organizational maturity and implementation approach.
The ROI Formula for Procurement Software (With a Real Example)
The standard formula for calculating procurement software ROI is:
ROI = (Total Benefits Gained - Total Investment Cost) / Total Investment Cost x 100
Here is how this works in practice.
Scenario: A mid-size manufacturing company processes 2,000 purchase orders per month. Before automation, the cost per PO (including labor, error correction, and overhead) was $85. After implementing procurement automation software, that cost dropped to $22 per PO.
Metric | Before Automation | After Automation |
Monthly PO volume | 2,000 | 2,000 |
Cost per PO | $85 | $22 |
Monthly processing cost | $170,000 | $44,000 |
Monthly savings | $126,000 | |
Annual savings | $1,512,000 |
If the annual software investment (licensing, implementation, and training) is $300,000, the ROI calculation looks like this:
ROI = ($1,512,000 - $300,000) / $300,000 x 100 = 404%
This is a conservative estimate that only accounts for hard processing cost savings. When you layer in reduced error rates, faster approvals, and improved contract compliance, the actual ROI figure is typically higher.
Note on benchmarks: APQC's Open Standards Benchmarking in Procurement consistently tracks cost per purchase order across industries and shows top-performing organizations process POs at significantly lower cost than median performers. Use your own baseline data wherever possible for the most accurate ROI projection.
What Is a Good ROI Target for Procurement Software?
A commonly cited procurement strategy benchmark is targeting a return of at least 10x on internal technology investments, though actual results vary significantly based on organization size, process maturity, and implementation quality.
In practice, here is what procurement teams typically see:
Organization Type | Typical ROI Range | Primary Value Driver |
Small to mid-size (under $500M spend) | 150% to 300% | Processing cost reduction |
Enterprise (over $500M spend) | 300% to 600%+ | Spend visibility and compliance |
High-volume transactional environments | 400% to 800%+ | Straight-through processing rates |
A realistic first-year ROI target for most mid-size organizations is 200% to 300%, with returns compounding as adoption deepens and more processes move under management.
If your projected ROI is below 150%, it is worth revisiting either the scope of automation or the choice of platform.
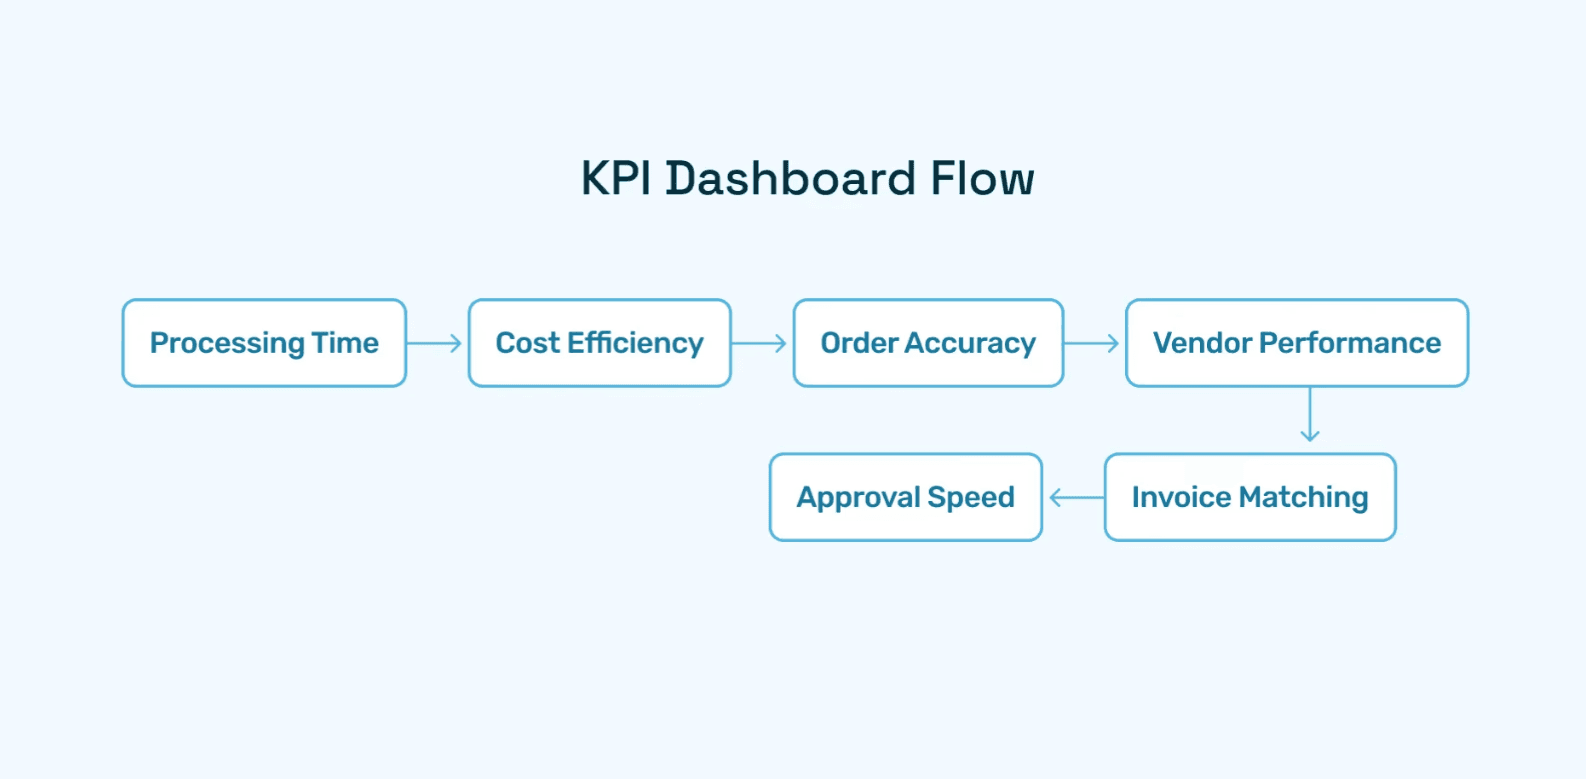
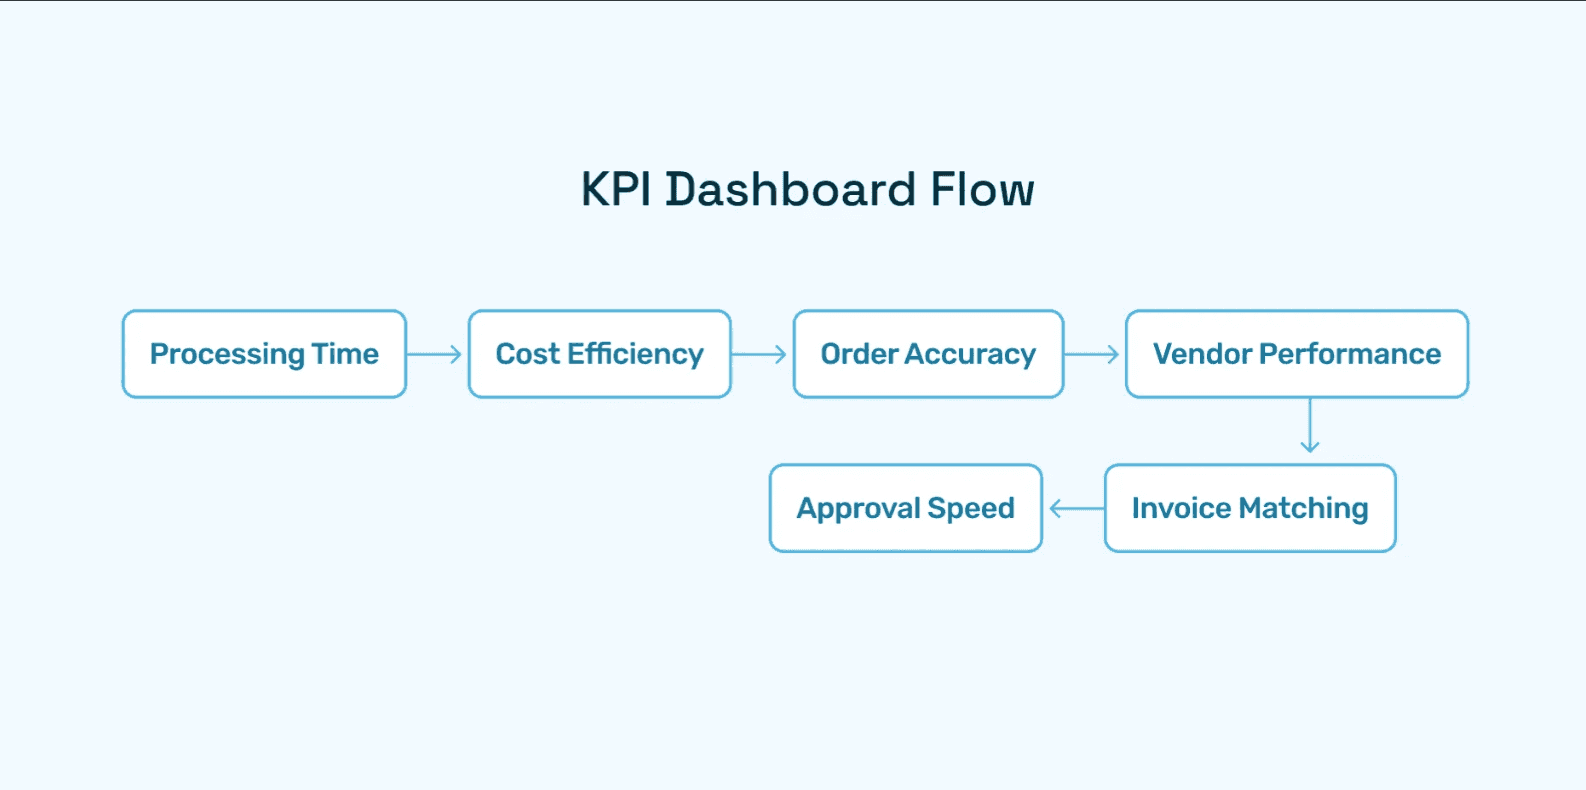
Essential PO Automation KPIs for Measuring Procurement Efficiency
Tracking the right PO automation KPIs is crucial for demonstrating value and identifying improvement opportunities. Leading organizations focus on both leading and lagging indicators to provide a comprehensive view of automation performance.
Financial Performance Metrics
Cost per Purchase Order
Baseline measurement before automation implementation
Post-implementation cost reduction tracking
Industry benchmarking for context
Processing Time Reduction
Average PO processing time (baseline vs. current)
Time-to-approval metrics
Exception handling efficiency
Error Rate Reduction
Manual processing error rates vs. automated
Compliance violation frequency
Rework and correction costs
Operational Efficiency Indicators
Straight-Through Processing Rate
Percentage of POs processed without manual intervention
Auto-approval rates within defined parameters
Exception management effectiveness
Vendor Response Times
Average time for vendor acknowledgment
Order fulfillment cycle times
Payment processing speed
User Adoption Metrics
System utilization rates across departments
User satisfaction scores
Training completion rates
Advanced Metrics for Comprehensive Procurement ROI Analysis
Beyond basic PO automation KPIs, sophisticated procurement efficiency software enables tracking of advanced metrics that provide deeper insights into organizational transformation.
Strategic Value Indicators
Spend Under Management
Percentage of total spend flowing through automated systems
Maverick spend reduction
Contract compliance rates
Supplier Performance Optimization
On-time delivery improvements
Quality metric enhancements
Supplier relationship scoring
Risk and Compliance Metrics
Audit trail completeness
Regulatory compliance rates
Fraud prevention effectiveness
Innovation and Scalability Measures
Process Standardization
Variance reduction across business units
Best practice adoption rates
Change management effectiveness
Data Quality Improvement
Master data accuracy rates
Reporting reliability metrics
Analytics utilization frequency
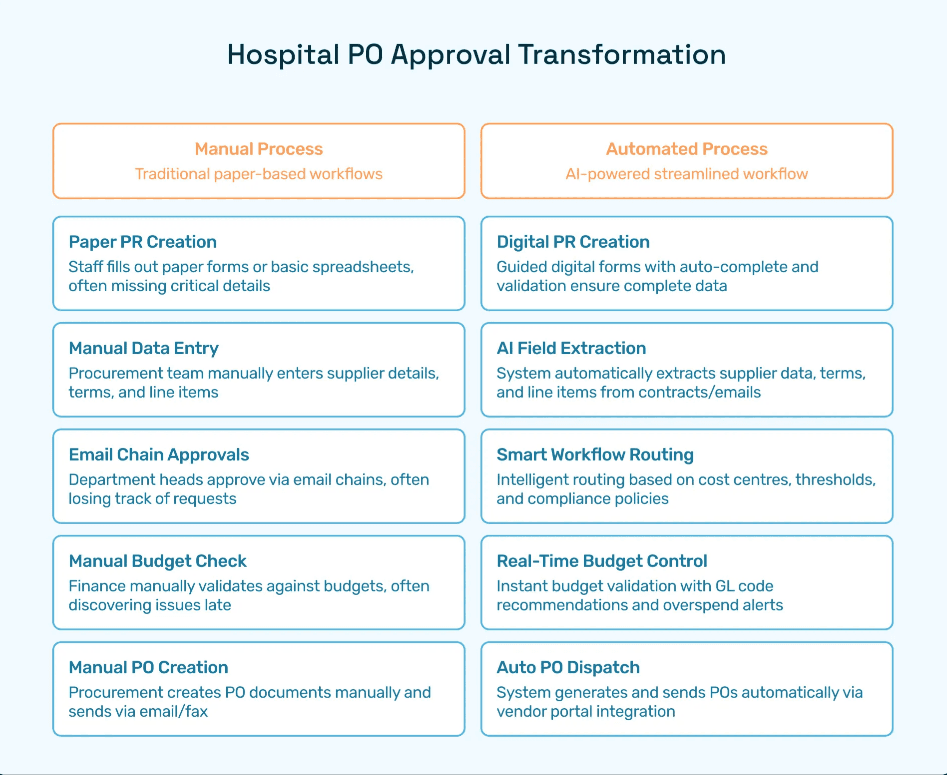
Manual vs. Automated Procurement: ROI Comparison
One of the clearest ways to frame procurement software ROI for internal stakeholders is a direct comparison of manual versus automated process performance. Here is a benchmark-based snapshot, drawing on APQC's procurement benchmarking research and Deloitte's 2025 Global Chief Procurement Officer Survey:
Metric | Manual Procurement | Automated Procurement | Typical Improvement |
Cost per PO | $75 to $150 | $10 to $25 | 70 to 85% reduction |
PO processing time | 3 to 7 days | Under 24 hours | 80 to 90% faster |
Invoice exception rate | 15 to 25% | 2 to 5% | Up to 80% fewer exceptions |
Contract compliance rate | 60 to 70% | 85 to 95% | 20 to 35% improvement |
Duplicate payment rate | 1 to 3% of invoices | Under 0.5% | Significant fraud prevention |
Spend under management | 50 to 65% | 80 to 95% | Greater strategic control |
The gap widens as transaction volume grows. For organizations processing more than 1,000 POs per month, the case for automation is almost always financially self-evident within the first year.
How Hyperbots Improves Procurement Software ROI
Hyperbots represents a meaningful shift in procurement efficiency software, leveraging advanced AI co-pilots to deliver comprehensive automation across the full procure-to-pay cycle. The platform includes specialized co-pilots for different functions, each designed to reduce manual effort and surface better data for decision-making.
Primary Co-pilot: Procurement Intelligence
The Procurement Co-Pilot serves as the cornerstone of Hyperbots' automation platform, delivering:
Cycle Time Reduction: Generate PR from PO in under 5 minutes
ERP Integration: Instant synchronization with existing enterprise systems
Real-time Visibility: Finance teams gain immediate spend transparency
Compliance Automation: Built-in controls ensure policy adherence
Supporting Co-pilots for End-to-End Automation
Automated invoice matching and validation
Exception handling with minimal human intervention
Real-time processing status updates
Automated onboarding and qualification processes
Performance monitoring and scoring
Risk assessment and mitigation
Predictive spend analysis
Contract optimization recommendations
Market intelligence integration
Key Differentiators from Traditional Solutions
AI-Native Architecture Unlike legacy procurement systems retrofitted with AI capabilities, Hyperbots is built from the ground up with artificial intelligence at its core, enabling more sophisticated decision-making and continuous learning.
No-Code Configuration Business users can modify workflows and rules without IT intervention, dramatically reducing implementation time and ongoing maintenance costs.
Industry-Specific Intelligence Pre-trained models understand procurement nuances across different industries, delivering value from day one without extensive customization.
Ready to see what ROI looks like for your procurement team? Book a Free Demo with Hyperbots and get a tailored ROI estimate based on your current PO volumes, headcount, and process complexity. No commitment required.
Quantifying the ROI Benefits of Hyperbots
Organizations implementing Hyperbots' AI co-pilots consistently achieve measurable ROI improvements across multiple dimensions. The platform's comprehensive approach to automation generates both immediate and long-term value.
Tangible ROI Benefits
Operational Cost Reduction Hyperbots' most significant value proposition lies in its ability to reduce operational costs by up to 80% through:
Staff reallocation from manual tasks to strategic initiatives
Reduced error rates and associated correction costs
Eliminated paper-based processes and associated overhead
Processing Time Improvements
Reduction in PO creation time
Faster approval cycles
Improvement in vendor response times
Accuracy Enhancements
Reduction in data entry errors
Automated policy compliance
Decrease in invoice disputes
Intangible Value Creation
Enhanced Decision-Making Capability Real-time analytics and spend visibility enable procurement teams to make data-driven decisions that compound value over time.
Risk Mitigation Automated compliance monitoring and audit trails reduce regulatory risk and associated costs.
Strategic Resource Reallocation Teams can focus on supplier relationship management, strategic sourcing, and market analysis rather than transactional activities.
How to Implement a Procurement ROI Measurement Framework
Successful ROI measurement for procurement efficiency software requires a structured approach that encompasses baseline establishment, ongoing monitoring, and continuous optimization.
Phase 1: Baseline Establishment
Current State Assessment
Document existing process costs and timelines
Identify manual touchpoints and inefficiencies
Establish benchmark metrics for comparison
Stakeholder Alignment
Define success criteria across departments
Establish measurement responsibilities
Create reporting cadence and formats
Phase 2: Implementation Tracking
Leading Indicators Monitoring
User adoption rates and training completion
System utilization metrics
Early efficiency improvements
Process Migration Measurement
Percentage of transactions migrated to automated systems
Exception handling rates
Quality metrics during transition
Phase 3: Ongoing Optimization
Performance Analytics
Regular review of KPI trends and patterns
Identification of optimization opportunities
Benchmarking against industry standards
Continuous Improvement Integration
Feedback loop establishment for user experience
Process refinement based on data insights
Technology capability expansion planning
Best Practices for Maximizing Automation ROI
Achieving optimal ROI from procurement efficiency software requires adherence to proven best practices that ensure successful implementation and sustained value delivery.
Strategic Planning Essentials
Phased Implementation Approach
Start with high-volume, standardized processes
Gradually expand to complex procurement scenarios
Maintain focus on user adoption and change management
Cross-Functional Collaboration
Engage IT, Finance, and Procurement teams from project inception
Establish clear communication channels and decision-making processes
Create shared success metrics and accountability structures
Technology Optimization Strategies
Data Quality Foundation
Cleanse and standardize master data before implementation
Establish ongoing data governance processes
Implement validation rules and quality controls
Integration Architecture
Ensure seamless connectivity with existing ERP systems
Plan for future technology additions and upgrades
Maintain security and compliance standards throughout
Change Management Excellence
User Training and Support
Develop role-specific training programs
Create comprehensive documentation and resources
Establish ongoing support mechanisms
Communication and Engagement
Regular updates on project progress and benefits
Recognition programs for early adopters and champions
Feedback collection and response mechanisms
Common Mistakes When Measuring Procurement ROI
Even well-resourced procurement teams leave value on the table by measuring ROI incorrectly. These are the most common errors to avoid:
1. Starting without a baseline If you did not document your pre-implementation costs and cycle times, you have nothing to compare against. Many teams skip this step in the rush to go live and then struggle to demonstrate value six months later. Establish your baseline before you flip the switch.
2. Only counting hard savings Focusing exclusively on direct cost reduction underestimates total ROI by a significant margin. Soft savings including faster approvals, better supplier terms, and improved compliance frequently represent 30 to 50% of total value realized.
3. Measuring too early Pulling ROI data at the 30 or 60-day mark typically shows incomplete results. User adoption takes time, exception rates stabilize after the first few months, and strategic benefits like spend visibility compound over quarters, not weeks.
4. Ignoring user adoption rates Technology ROI is directly tied to how many people use the system correctly. Organizations with strong change management programs consistently report 40 to 60% higher returns than those that treat adoption as an afterthought.
5. Treating ROI measurement as a one-time exercise Procurement automation ROI is not static. Costs shift, volumes change, and new features roll out. Building a quarterly review process into your operating rhythm ensures you are capturing the full picture and identifying new optimization opportunities as they emerge.
Future Trends in Procurement ROI Measurement
The landscape of procurement efficiency software continues to evolve, driven by advances in artificial intelligence, machine learning, and predictive analytics. Understanding emerging trends helps organizations prepare for the next generation of ROI measurement and value creation.
Advanced Analytics Integration
Predictive ROI Modeling
AI-powered forecasting of automation benefits
Scenario planning for different implementation approaches
Risk-adjusted ROI calculations
Real-time Performance Monitoring
Continuous measurement and reporting
Automated alert systems for performance deviation
Dynamic optimization recommendations
Expanded Value Metrics
Sustainability Impact Measurement
Carbon footprint reduction tracking
Sustainable sourcing metrics
Environmental ROI quantification
Innovation Enablement Metrics
Time freed for strategic initiatives
New value creation opportunities
Market responsiveness improvements
According to Gartner's IT spending forecast, software spending is expected to grow 14% to reach $1.23 trillion in 2025, reflecting the continued enterprise push toward digital transformation and the growing need for sophisticated ROI measurement to justify these investments.
Getting Started with Procurement Efficiency Software
Organizations ready to embark on their procurement automation journey can achieve rapid ROI realization through a structured implementation approach. Hyperbots' AI co-pilots are designed to deliver value quickly while providing the foundation for long-term transformation.
Assessment and Planning Phase
Current State Analysis Begin with a comprehensive evaluation of existing procurement processes, identifying inefficiencies, manual touchpoints, and improvement opportunities. This baseline assessment forms the foundation for ROI measurement and success tracking.
Technology Requirements Definition Collaborate with stakeholders to define functional requirements, integration needs, and success criteria. Consider scalability requirements and future expansion plans to ensure sustainable value delivery.
Rapid Implementation Methodology
Pilot Program Launch Start with a focused pilot program targeting high-impact, low-complexity processes. This approach enables rapid value demonstration while building organizational confidence and expertise.
Phased Rollout Strategy Expand automation capabilities systematically across departments and process areas, maintaining focus on user adoption and continuous improvement.
Success Measurement and Optimization
Regular Performance Reviews Establish monthly and quarterly review processes to track progress against established KPIs and identify optimization opportunities.
Continuous Enhancement Planning Leverage insights from ongoing measurement to expand automation capabilities and enhance ROI performance over time.
The Hyperbots platform's unique combination of AI intelligence, rapid implementation, and comprehensive automation capabilities positions organizations to achieve exceptional ROI results while building the foundation for long-term procurement excellence.
See Hyperbots in Action Curious what a higher ROI could look like for your team? Start your free trial or schedule a personalized demo to walk through the platform with a procurement specialist. Most teams identify their first major savings opportunity within the first session.
Frequently Asked Questions
Q: How long does it typically take to see ROI from procurement efficiency software?
A: Most organizations begin seeing measurable benefits within 3 to 6 months of implementation. Hyperbots' clients often achieve positive ROI within the first quarter due to the platform's rapid deployment capabilities and immediate efficiency gains.
Q: What are the most important PO automation KPIs to track?
A: Focus on cost per purchase order, processing time reduction, error rates, straight-through processing rates, and user adoption metrics. These provide a comprehensive view of both financial and operational improvements.
Q: What factors most significantly impact procurement automation ROI?
A: User adoption rates, data quality, process standardization, and change management effectiveness are the primary factors determining ROI success. Organizations with strong change management achieve 40 to 60% higher returns.
Q: How should organizations handle ROI measurement for intangible benefits?
A: Develop proxy metrics for intangible benefits such as improved decision-making speed, risk reduction, and strategic capability enhancement. Use balanced scorecards that combine financial and operational indicators.
Q: What role does vendor selection play in achieving target ROI?
A: Vendor selection is critical. Platforms with pre-built AI intelligence, rapid implementation capabilities, and comprehensive automation features significantly accelerate ROI achievement compared to custom-built or legacy solutions.